Decoding Compensation, Part II: FairOffer.ai
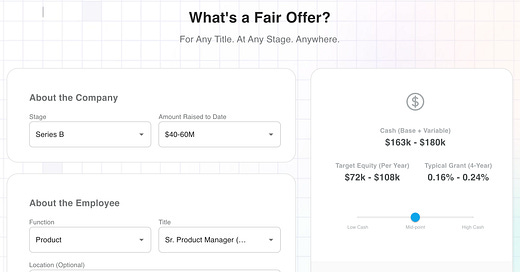
Introducing FairOffer.ai, a tool to algorithmically estimate fair compensation — for any title, at any stage of company, anywhere in the world.
If you like this post, please forward it on and/or share on X :).
First time here? This post stands on its own, but it might be useful to check out the context from Part I (out of three parts) here.
After thousands of regressions, analyses and backtests, we’ve determined that there are only 3 inputs (i.e., independent variables) in determining “total rewards” compensation for any employee:
“Entry level” salary
Title / Level
Stage of Company
(For those less familiar, Total Rewards is an industry term for the sum of base salary, incentive compensation, and equity; sometimes, it is used in a way that includes benefits, but we are not including that for the purposes of our methodology.)
This post covers the methodology:
discussing individual patterns produced by the above independent variables in isolation
then setting them in the context of an overarching compensation framework
providing the actual formulas underlying each step, and integrate them.
The result: FairOffer.ai.
Market-wide entry-level salary
First, we need to set the figure for a Baseline Level 1. It’s the foundational piece for any ladder — you start at the bottom and work your way up the titles from there, and serves as an anchor for the algorithm.
With the Fair Offer Baseline, we work off Zone 1 salary — San Francisco & New York City (with the intent of applying location adjustments later on; more on this in Part III tomorrow).
In earlier iterations of the model, I used a “plug” — a constant that seemed like a roughly reasonable figure for a full-time, entry-level office worker in San Francisco or New York City.
However, during more recent iterations, it became clear that there is an external market force setting this, by regulation: minimum exempt salaries. Specifically, California and New York City are the highest, with California clocking in at $66,560 for 2024 (and $64,480 the year before that).
Given this is an objective market standard set by regulation, this is what the algorithm uses for organic inflation adjustments in the model. We index this figure against the leveling for the earliest stage company (more on that in the formulas listed below).
Total Rewards by Level: an exponential pattern up the ladder
Next up, we need to determine how the Total Rewards should be calculated as you rise up the ladder.
The most important realization that made the Fair Offer Algorithm possible, is that there is a constant “multiplier” for compensation between levels within a given function.
In other words, the difference between levels in a given function in the market neatly follows an exponential function for total rewards (as opposed a linear function). E.g., If a Sr. Manager in Finance makes $150K and a Finance Manager makes $120K, this is not because each level makes $30K more than the one below, but rather that each level makes 25% more.
This isn't something the industry got together and planned; rather, this is the natural way that the "wisdom of the crowds" have settled, to estimate the market value of employees as a function of seniority.
This multiplier effectively ends up being a “golden ratio” for the levels for any given company. It ranges from 1.15 (for the very earlier stage company — at founding) to 1.35 (for companies that are the most mature from a compensation. perspective).
This simple difference ends up having a dramatic effect due to compounding, and is more commensurate with what we see in the market. (Note that the below examples are for total rewards, not base salary.)
Here’s an example of the finance function at a Series ~B company, for NY / SF:
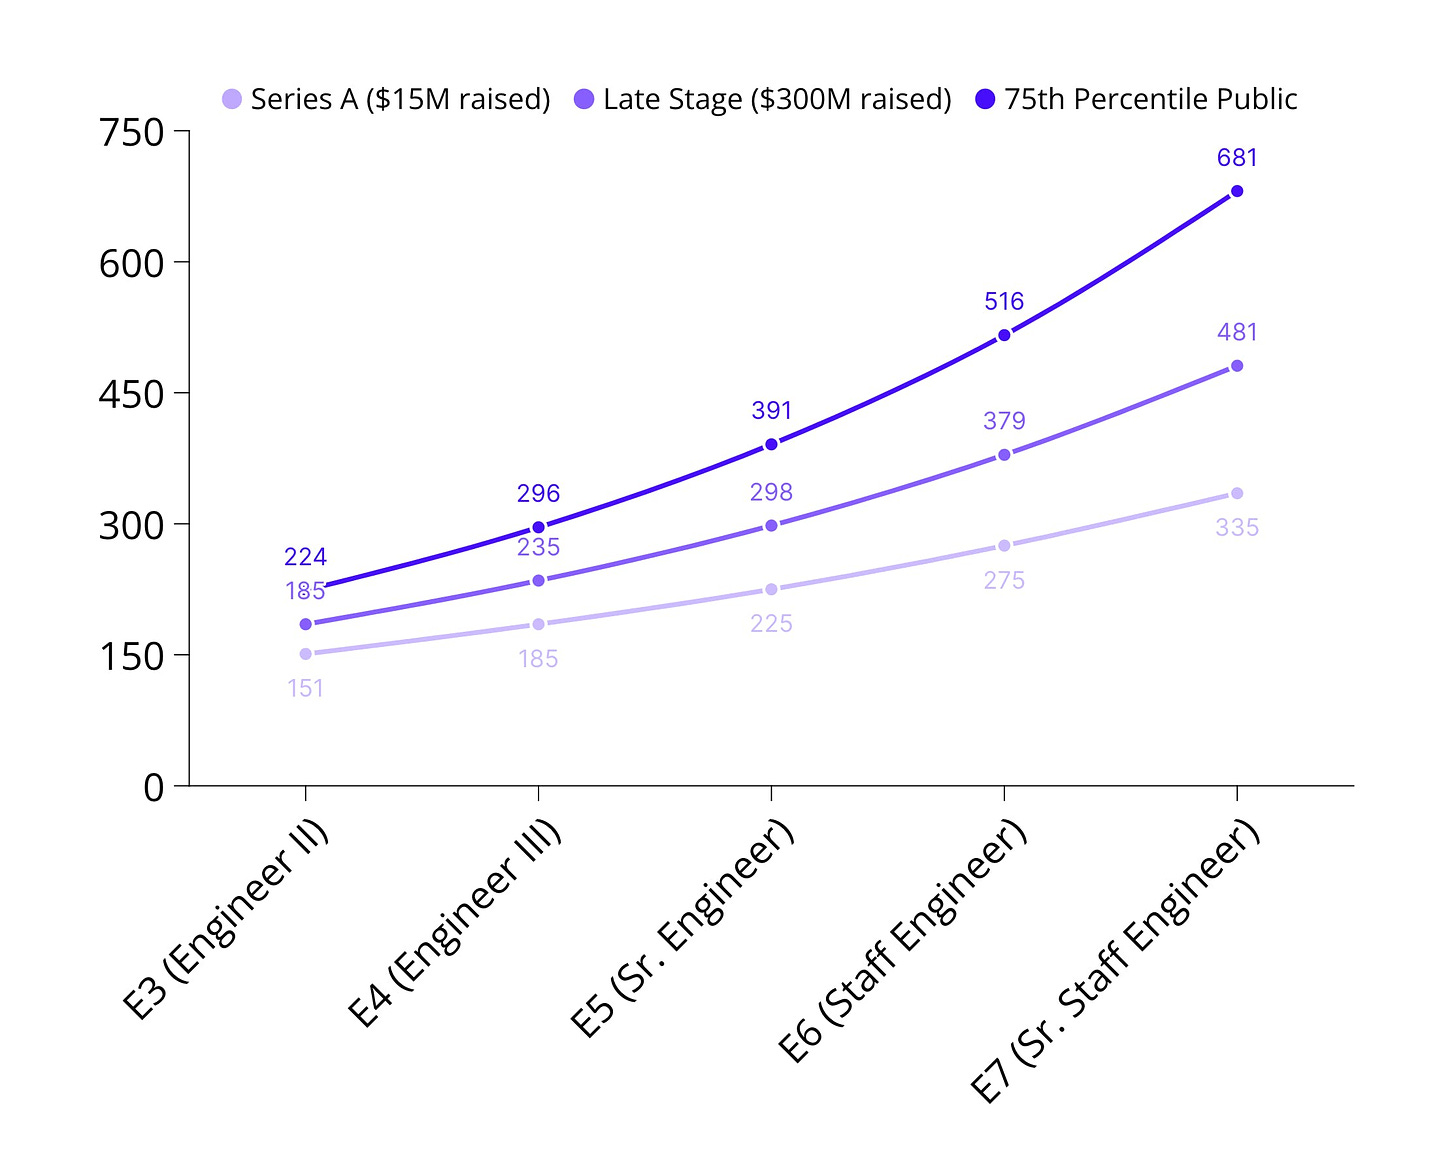
The later the stage of the company, the higher the leveling multiplier.
Entry level roles are fairly similar at any company, but compensation higher up the chain rises much more significantly at large, mature companies than it does at a small organization. For example, an engineering leveling guide might look like the following at example early stage (where each level makes vs. late stage vs. public company.
Applying the algorithmic patterns to a standardized leveling guide
OK so how do we map these isolated patterns back, to establish a standard and algorithmic approach to compensation?
The trickiest part in this step is that Levels (and corresponding) Titles are dramatically different across various functions. This is partially due to semantics, and partially due to the labor market for various roles.
Nevertheless, it’s very clear that a Director of Operations, Director of Engineering, and a Director of Customer Support do not have the same compensation in the market.
Currently, best practice is to create separate compensation levels & total rewards for each function. This may be necessary and prudent.
However, it started to become clear during our analysis that it is better to start with a single ladder of “Baseline Levels,” and simply map back the different titles (and functional levels) to a single ladder. It is not perfect, but it surprisingly gets 95% of the way there.
I was skeptical of this too, but it works reasonably well in most cases; you may choose to tailor individual levels as you customize Fair Offer for your company (as you should!). However, we recommend starting from the approach above, rather than starting from scratch.
There is one huge benefit to setting the Baseline Levels and indexing functional levels & titles to it: making periodic company wide adjustments for inflation, or as you change your compensation framework completely (e.g., going from Series A to B, or from late-stage to public) is dramatically easier with 12-15 levels rather than 100+ levels.
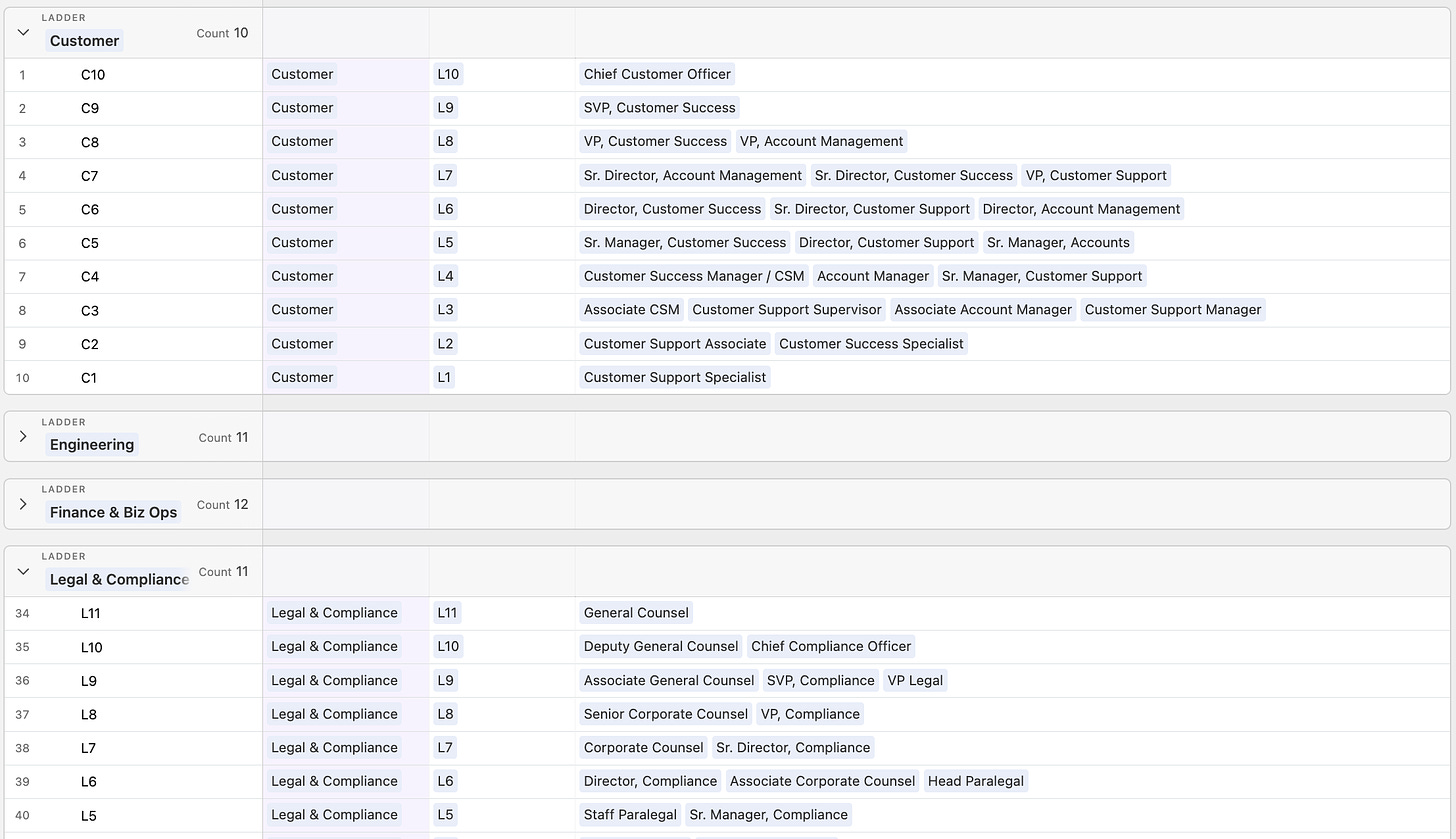
So how would this mapping look? Through a combination of regressions and trial and error, we’ve found that the titles & functional levels cluster in the following way.
Here is a sampling of mid-to-senior levels for illustrative purposes:
Here is the full table of the 200+ Titles covered by Fair Offer today, the Functional Levels, and the Baseline Levels they map to (click this link or the preview image below to access):
There is no “industry standard” but this is the most common set of titles and ladders that we’ve observed. Perhaps one side effect of Fair Offer will be that this will be more standardized against “Fair Offer titles,” but execs and HR teams are understandably quite opinionated on this topic!
Combining the inputs to generate a fair offer
The combination of these formulas are surprisingly simple.
Where
ExemptThreshold = $66,560 (for 2024)
Multiplier ranges from 1.15 (founding stage) ~ 1.35 (90th+ percentile public company)
L is the Baseline Level, and ranges from 1 (entry level) ~ 12 (executive) according to the mapping table provided above
That’s it, surprising though it may seem.
If you’d like to backtest this, head on over to FairOffer.ai to try out combinations.
Coming Next: the third & final post in this series
Tomorrow, we'll cover cash-equity splits, and potential ways to address location-based adjustments.


